Urban Planning
A Permanent Record of Asset Performance
Our sensors and AI cameras measure your streets, roadways, and utilities continuously — and every reading is kept. Query years of it on our platform, or have us feed it into the GIS your team already runs.
01 /The Data Gap
Data That Barely Exists Anywhere Today
Continuous readings from streets, roadways, and utilities are scarce almost everywhere — which is exactly what makes them worth having.
Gostly closes that gap at the source. We supply the sensors and cameras that produce this data — deployed by our crews or by your own team — so you can track your streets and infrastructure live today, and because every reading is kept, the same feed becomes a historical record almost no one else in your region has.
02 /The Data We Create
Once the Hardware Is In, the Record Exists
This is data that didn't exist in your jurisdiction until the devices producing it went in — installed by our crews or by your own team — and it starts accumulating on day one.
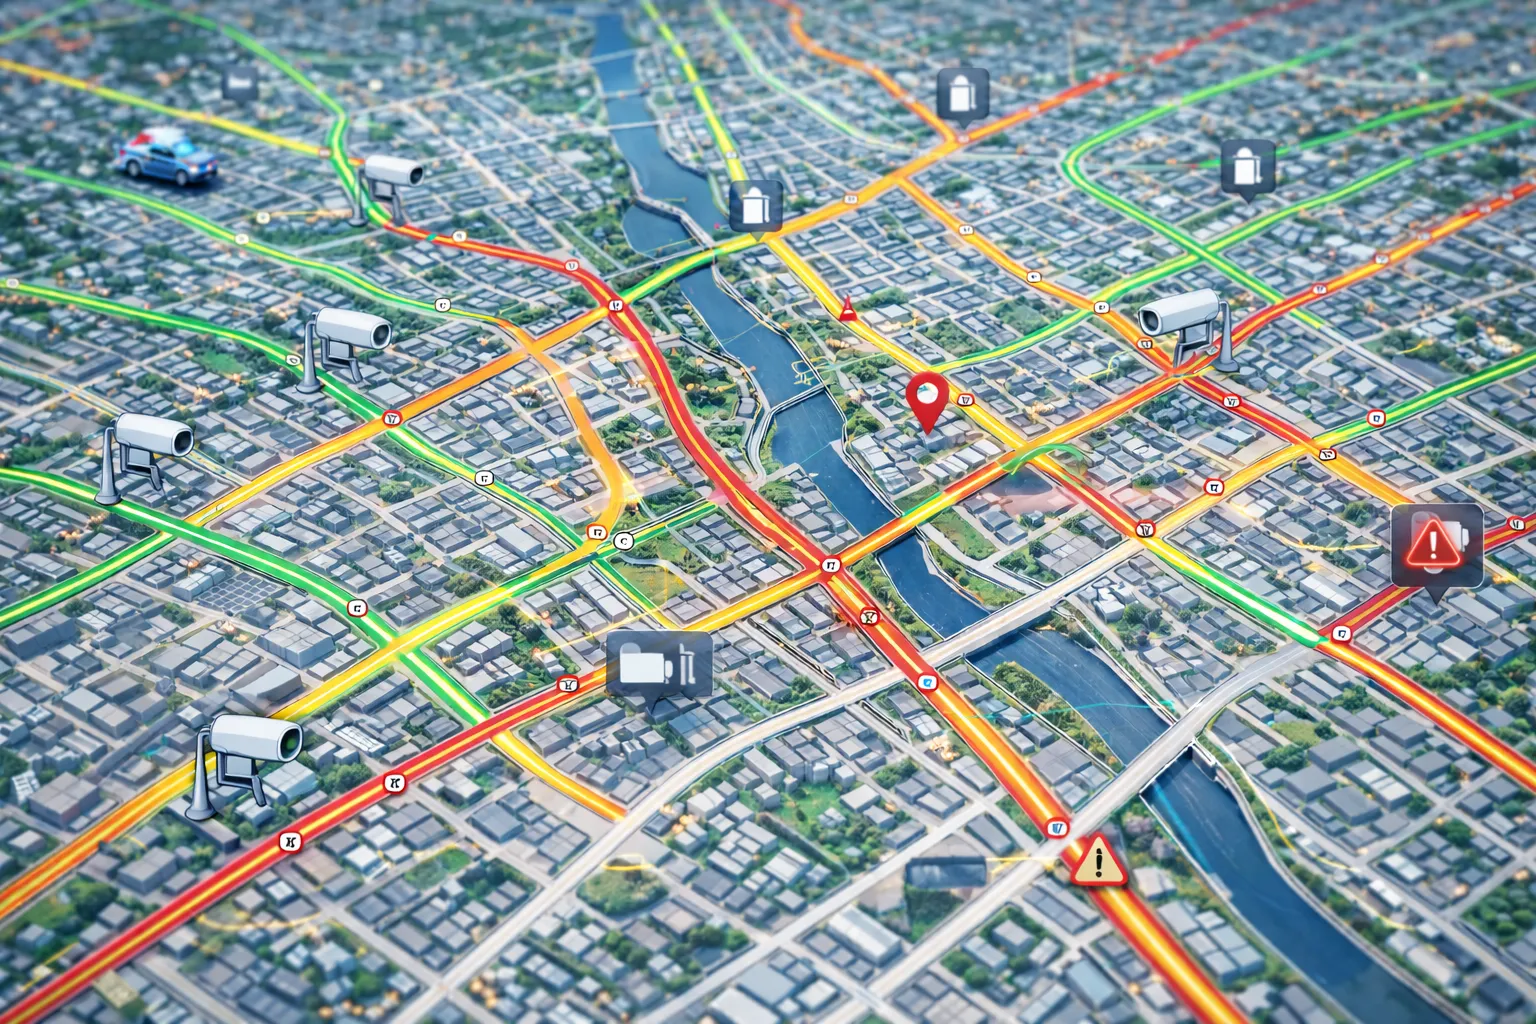
Our cameras — or the ones you already have, retrofitted — measure the street continuously instead of for two days in October.
- Volume and classification: cars, trucks, buses, bikes, pedestrians
- Speed distributions, including 85th percentile by hour, day, and season
- Turning movements, queue length, and delay by approach
- Near-miss conflicts, red-light running, and pedestrian crossing behavior
- Origin–destination and route choice across a corridor
- Curb and parking activity: occupancy, turnover, dwell time, and violations

Sensors on the roadway and the systems beneath it, logging from the day they go live and never stopping.
- Cut-through traffic and vibration on residential streets
- Flood depth at culverts, underpasses, and known low points
- Road surface temperature and freeze-thaw events
- Noise and air quality alongside the traffic that produced it
- Water, gas, and power demand by district and development
03 /In Practice
What Planners Actually Do With It
A few short examples of questions that are unanswerable from a one-off study, and straightforward once the readings accumulate.
Ex. 01
Find where the system actually fails in the rain
Line up flood depth and leak events against rainfall intensity, and the culverts, underpasses, and mains that fail first — and at what threshold — sort themselves into a ranked list. A repeat-offender map for the capital plan instead of a pile of complaints.
Ex. 02
Ground-truth your travel demand model
Compare measured volumes and turning directions against the probe and big-data estimates you license today. Where they diverge, you finally have the real number to recalibrate the model against.
Ex. 03
Fix the curb where it's actually failing
Occupancy and turnover at comparable sites, set against the blocks where double-parking and loading violations actually cluster. Together they show where the curb needs a loading zone, a time limit, or pricing — and give you a measured basis for changing parking minimums.
Ex. 04
Rank intersections before anyone is hurt
Crashes are rare, lagging, and under-reported — a corridor can look safe on paper right up until it isn't. Our cameras count the near misses, red-light running, and unsafe turns that happen every week, so you can rank intersections by observed risk and fix the worst ones first.
04 /Two Ways to Use It
Query It Here, or Get It Into Your GIS
Your GIS team can already draw a layer on a map. What they can't do is generate the data underneath it, or keep it refreshing. Once we've collected it, it's yours either way.
Ask questions of your own archive directly — no export, no GIS license, no consultant.
- 85th percentile speeds by block, hour, and season for a calming or speed-limit case
- Before-and-after comparison around any project date, with the confidence interval
- A developer's projected trip generation against what comparable sites actually measure
- Baseline and post-project numbers for SS4A, RAISE, and HSIP applications
- Plain-language questions across years of readings
It's your data. We'll set up a feed into ArcGIS or whatever your team already runs — along with the rest of the transportation and infrastructure data we collect.
- Feature services, GeoJSON, CSV, or API access, configured with your team
- Bundled with our other mobility and infrastructure datasets
- Joined to your parcels, zoning, permits, crash records, and transit data
- One coordinate frame and one clock, so the join is already done
- Full history, not just the current value
05 /Platform
Built on the Gostly Platform
This solution is powered by the following platform modules.
Your Archive Starts the Day You Install
Historical data is the one thing you can't buy retroactively. Sensors and cameras deployed this quarter become the baseline behind every corridor study, grant application, and rezoning decision you make for the next decade.